What Is a Good PageSpeed Score?
Chasing a green ninety is the most common misallocation of effort in web performance. The number is useful as a diagnostic and misleading as a target, because it is computed from a single synthetic load on throttled hardware that may resemble nobody in your actual audience.
How is the Lighthouse performance score calculated?
It is a weighted average of five lab metrics: Largest Contentful Paint, Total Blocking Time, Cumulative Layout Shift, First Contentful Paint and Speed Index. Each is scored against a distribution of real sites, then combined. Total Blocking Time and LCP carry the heaviest weights.
Because the weights are uneven, two sites with identical scores can have very different problems. A site at 72 might be failing entirely on blocking JavaScript while another at 72 loads instantly but shifts layout badly. The composite hides which.
Why does the score change between runs?
Lighthouse throttles CPU and network to simulate a mid-tier device, and the simulation is sensitive to what else the machine is doing. Variance of five to ten points between consecutive runs on the same page is normal, and larger swings happen on shared or busy hardware.
The practical consequence is that a single run proves little. Run three or five and take the median before concluding a change helped. Treating a two-point movement as a result is reading noise, and a surprising amount of performance work is justified on exactly that basis.
What should you target instead?
Pass Core Web Vitals in field data: LCP at or under 2.5 seconds, INP at or under 200 milliseconds, CLS at or under 0.1, each at the 75th percentile. That is the assessment Google actually uses, and it reflects your real audience rather than a simulated device.
Use the Lighthouse score as a development-time signal that a change moved something, and Search Console or CrUX data as the measure of whether it mattered. Sites frequently pass Core Web Vitals while scoring in the seventies, and that combination is fine.
Is a perfect 100 worth pursuing?
Rarely. The last ten points typically cost disproportionate effort and often require removing functionality that exists for good commercial reasons: analytics, consent management, embedded media, third-party widgets. Diminishing returns set in sharply once the page passes the Core Web Vitals thresholds.
There is also a measurement trap. Optimising to the simulated device Lighthouse models can produce changes that help the score and do nothing for real users, particularly around resource prioritisation tuned to the throttling profile rather than to actual network conditions.
Key takeaways
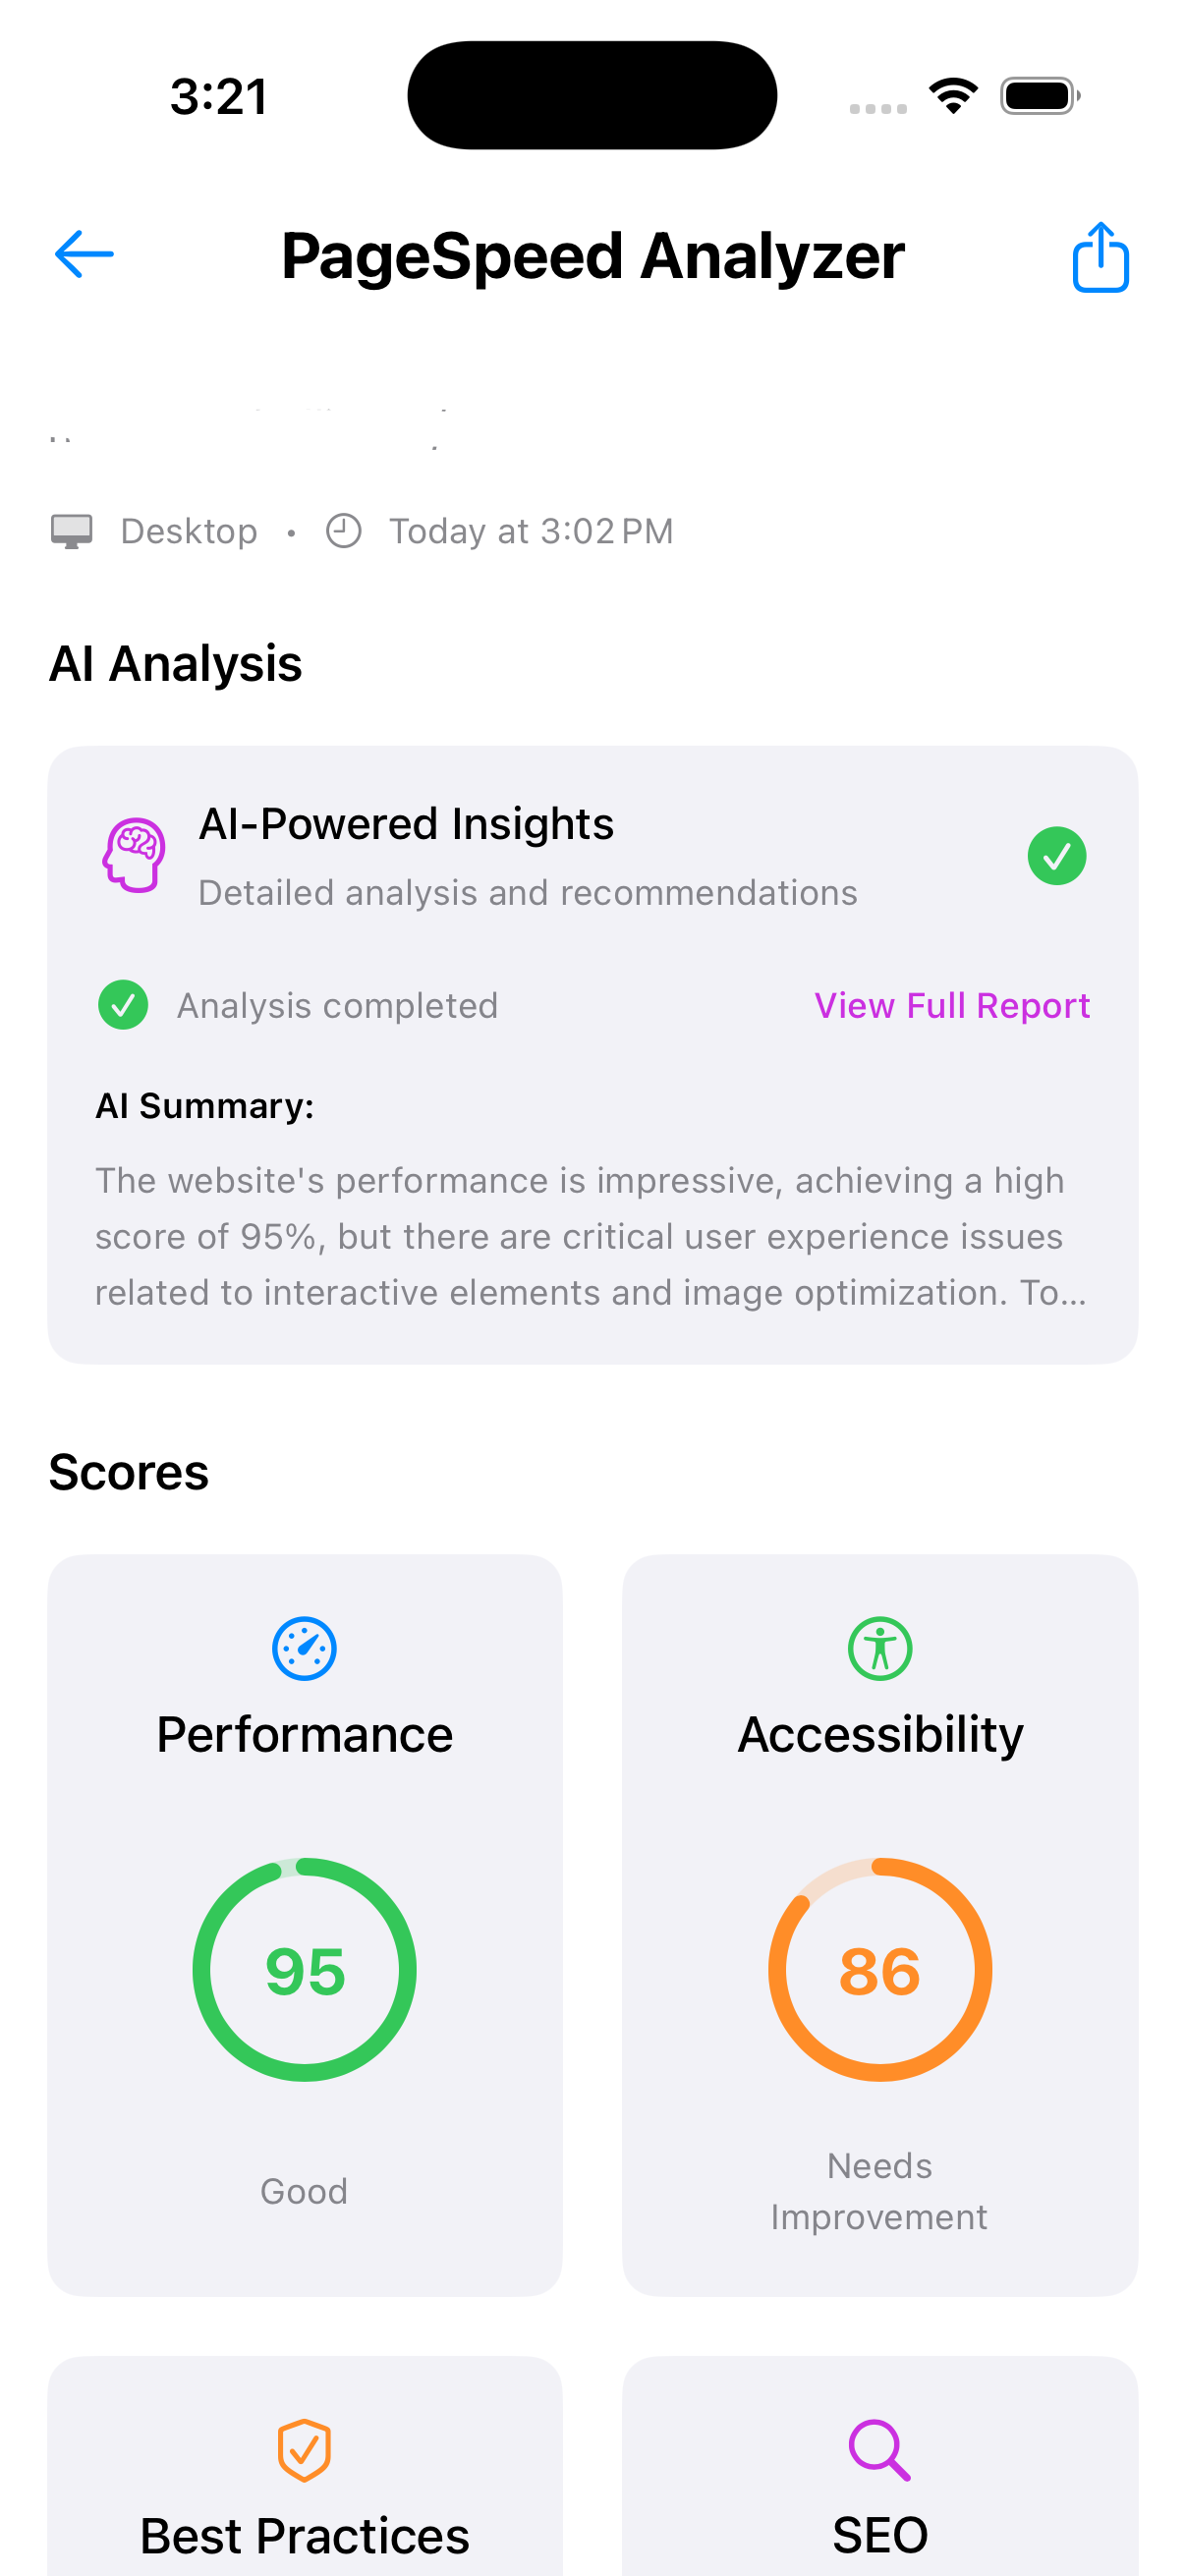
- Lighthouse bands are 90 to 100 good, 50 to 89 needs improvement, 0 to 49 poor.
- The score is a weighted composite, so identical scores can hide different problems.
- Run-to-run variance of five to ten points is normal; take a median of several runs.
- Core Web Vitals field data, not the Lighthouse score, is what Google uses.
- Passing the thresholds at a score in the seventies is a perfectly good outcome.
Frequently asked questions
- Is 90 a hard requirement for good rankings?
- No. Google does not use the Lighthouse score as a ranking signal at all. It uses Core Web Vitals field data, and those thresholds can be met by pages scoring well below 90. The 90 target is a Lighthouse convention that acquired unwarranted authority.
- Why does PageSpeed Insights show two different sets of numbers?
- The top section is field data from real Chrome users over 28 days, and the lower section is a Lighthouse lab run performed at the moment you requested it. They measure different things on different hardware, so disagreement between them is expected rather than a fault.
- Does the score differ by testing location?
- Yes, since network latency to your origin varies by where the test runs from. A site served from a single region scores worse when tested from far away. This is one reason lab scores from different tools disagree, and a reason to compare like with like when tracking over time.
- Should you optimise for the score or for users?
- For users, measured through field data. The two usually align, because most score improvements genuinely help. They diverge at the margins, where tactics that game the simulated environment produce score gains without changing what any real visitor experiences.
Web Performance, BigBalli. We track Core Web Vitals definitions and thresholds as Google revises them, cross-checked against web.dev and Chrome developer documentation.